Table of Contents
manipulation, validation and exploration of pedigrees
peddy compares familial-relationships and sexes as reported in a PED/FAM file with those inferred from a VCF.
It samples the VCF at about 25000 sites (plus chrX) to accurately estimate relatedness, IBS0, heterozygosity, sex and ancestry. It uses 2504 thousand genome samples as backgrounds to calibrate the relatedness calculation and to make ancestry predictions.
It does this very quickly by sampling, by using C for computationally intensive parts, and by parallelization.
The command-line usage looks like:
python -m peddy -p 4 --plot ceph1463.vcf.gz ceph1463.ped
This will use 4 cpus to run various checks and create ceph1463.html which you can open in any browser to interactively explore your data. Unless you have triple digit numbers of samples, using more than 4 cpus will give only marginal improvement.
It will also create create 4 csv files and 4 static QC plots that mirror those in the interactive html. These will indicate:
- discrepancies between ped-reported and genotype-inferred relations
- discrepancies between ped-reported and genotype-inferred sex
- samples with higher levels of HET calls, lower depth, or more variance in b-allele-frequency (alt / (ref + alt )) for het calls.
- an ancestry prediction based on projection onto the thousand genomes principal components
Finally, it will create a new file ped file ceph1463.peddy.ped that also lists the most useful columns from the het-check and sex-check. Users can first look at this extended ped file for an overview of likely problems.
The columns in the CSV output are documented in CSV Output
Static Images
This will create a number of images:
Sex Check
A sex-check assumes that males should have very few heterozygote calls on the X- chromosome and females should have relatively many. Here, we see, as expected that there are no sex issues in the CEPH cohort:
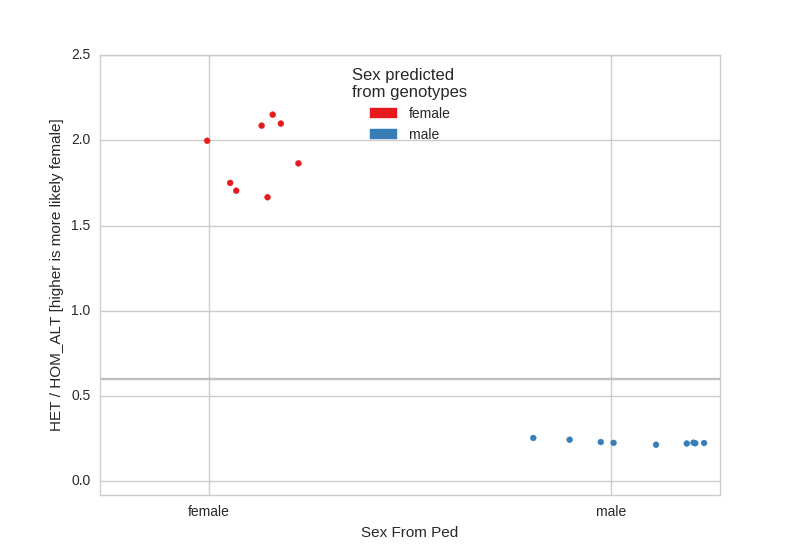
If there are samples with unspecified sex in the ped file, they will appear in the center of the plot as ‘unknown’.
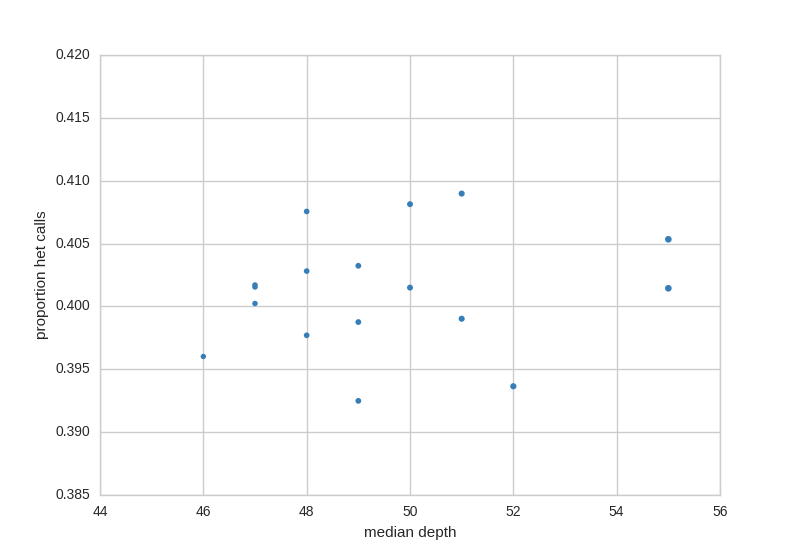
Het Check
The het check looks for samples with higher rates of het calls, usually, this can indicate sample contamination. This plot also shows depth along the X-axis as a way to quickly check for samples with lower coverage.
Ancestry Check
Since we know the ancestry of the thousand genomes samples we can project the current peddy input (in this case CEPH) onto the principal components of the thousand genomes samples and then predict the ancestry of incoming samples:
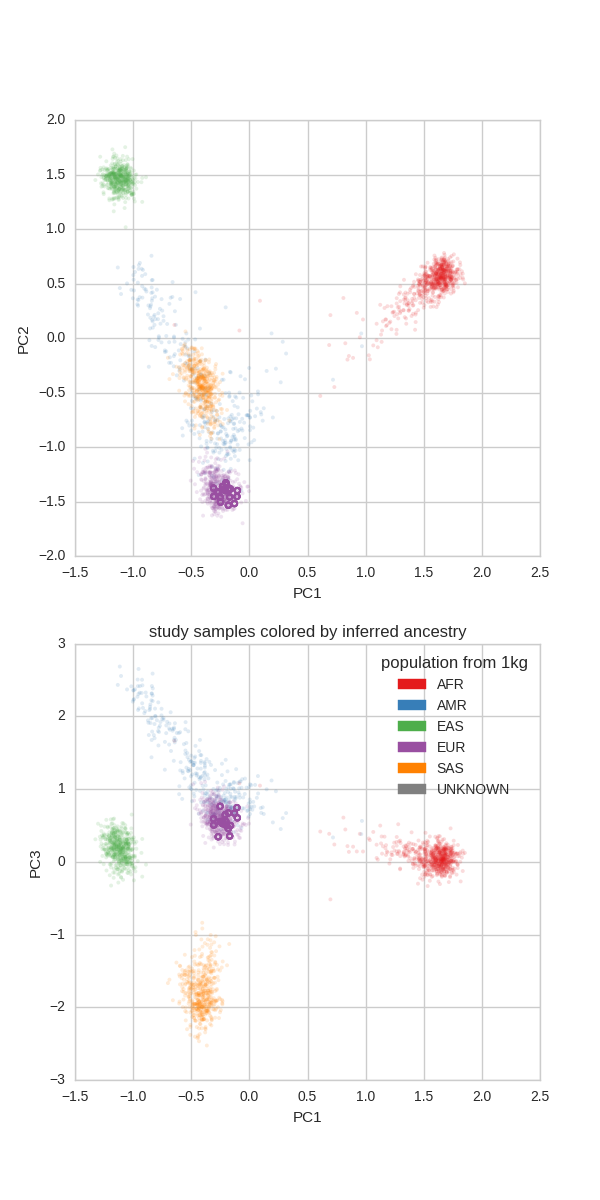
Note that, as expected all of the members of the CEPH pedigree are of ‘EUR’opean descent.
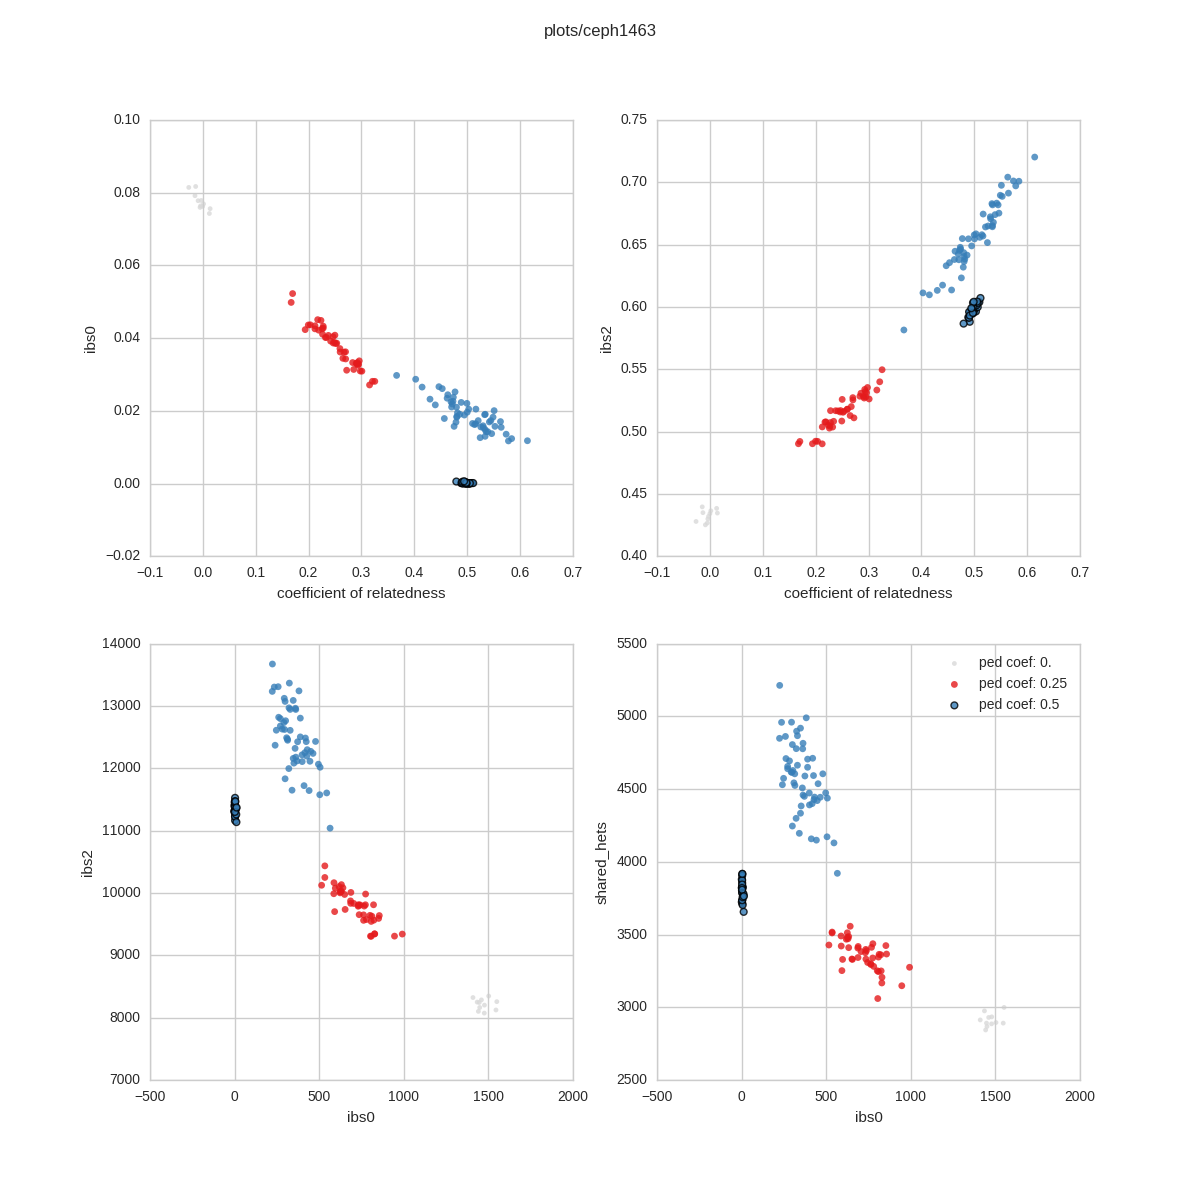
Relatedness Check
In this check, we compare the relatedness specified in the pedigree file to what is observed by the genotypes. For example, a sib-sib pair should have a relatedness coefficient of 0.5. In the plot, sample-pairs are *colored* according to their expected relatedness specified in the ped file and *located* in the plot according to their relatedness (and IBS levels) calculated from the genotypes
IBS0 is the number of sites for which the 2 samples shared 0 alleles. For parent-child pairs and IBS0 event is a (putative) de novo and so should happen very infrequently. Unrelated samples should have a relatedness of 0 and a higher IBS0.
IBS2 is the number of sites where the 2 samples are both het or both homozygous alternate.
CSVs
For each of those images, there is a corresponding .csv file. See CSV Output for a description of the columns.